Example Stock Report
For a grounding in some of the basic features such as criteria, groups etc, lets follow an example using the demonstration Northwind database.
To follow this yourself you can create the tables in the following sql script :- HereFor a grounding in some of the basic features such as criteria, groups etc, lets follow an example using the demonstration Northwind database.
To follow this yourself you can create the tables in the following sql script :- Here
SELECT  ProductID id, ProductName product, categories.CategoryID, UnitsInStock in_stock, UnitsOnOrder on_order, ReorderLevel,  companyname Company, country, categoryname category
FROM products
join suppliers on products.supplierid = suppliers.supplierid
join categories on products.categoryid = categories.categoryid
WHERE 1 = 1
ORDER BY categoryname
You should see something like as follows. Notice how we alias columns to provide alternative titles to the columns. Underscore characters will be replaced by spaces in the report labels.
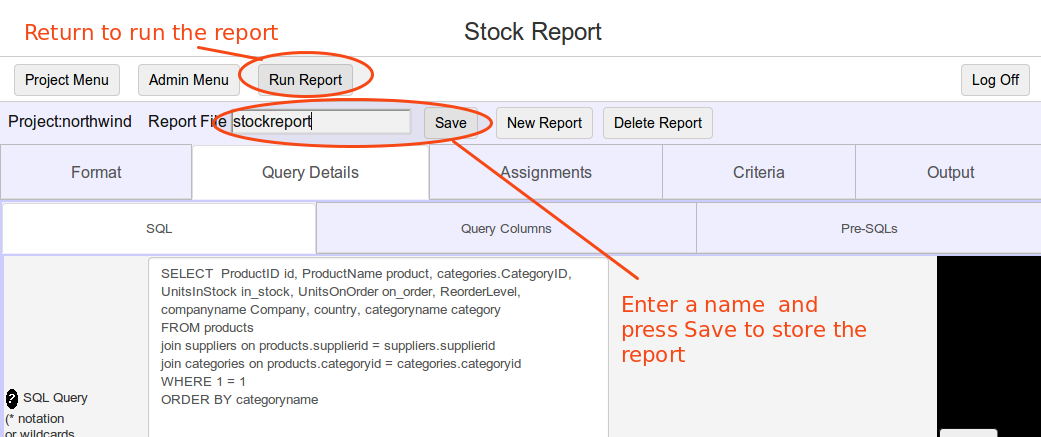
Make sure you press the Apply Button then press the "Run Report" button to return to the report execution screen. Run the report by pressing either of the buttons highlighted below
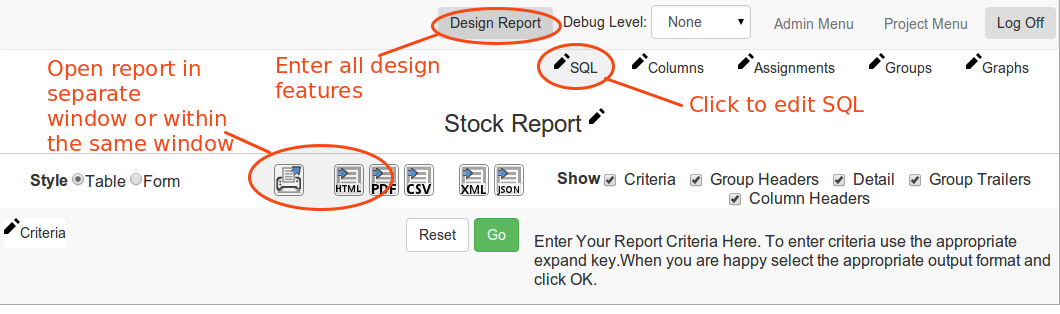
You should see report output as follows :-
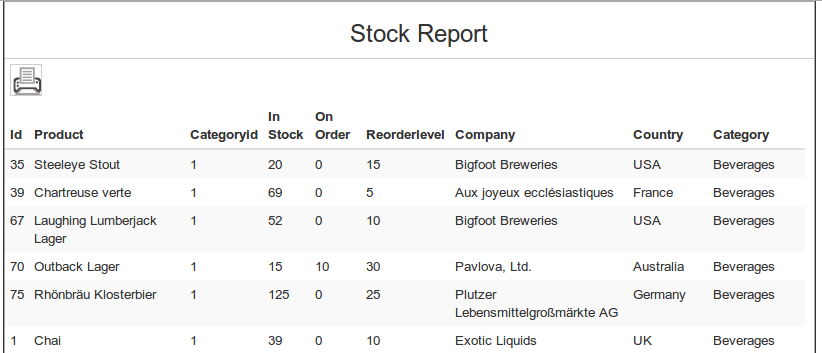
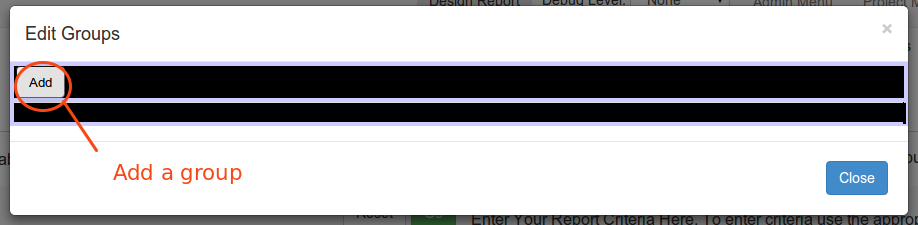
Click on the Add button to show this:-
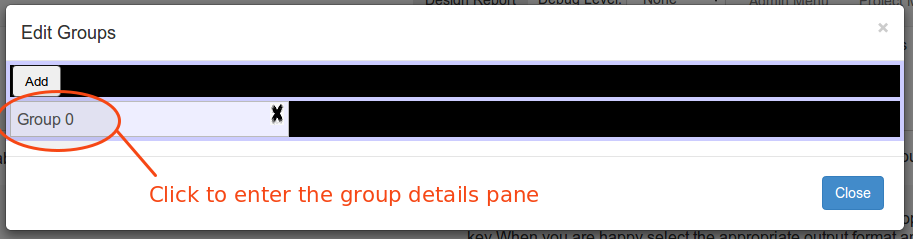
then click on the Group 0 button to show the group details tab.
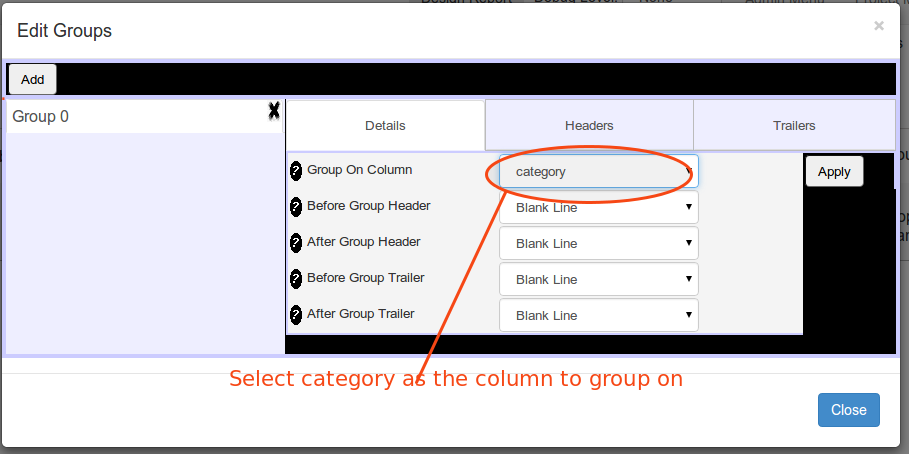
Select the column categoryname to group on and press
Apply. We are now grouping by category so next define our group header. Click on the Headers Tab to reveal this pane:-
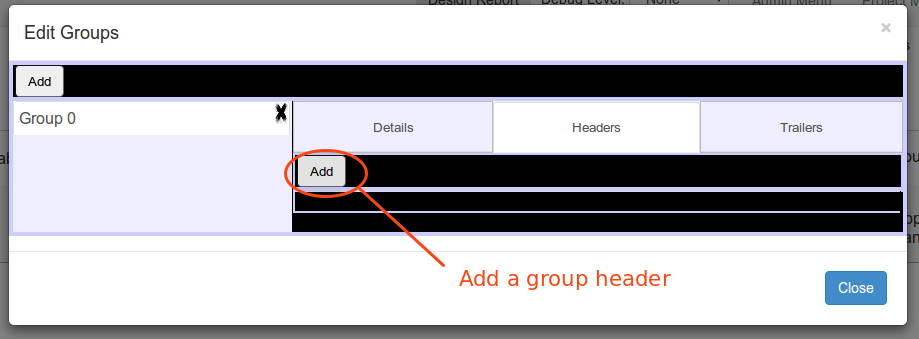
Click on the Add button to add a header, and set the group header column to category.
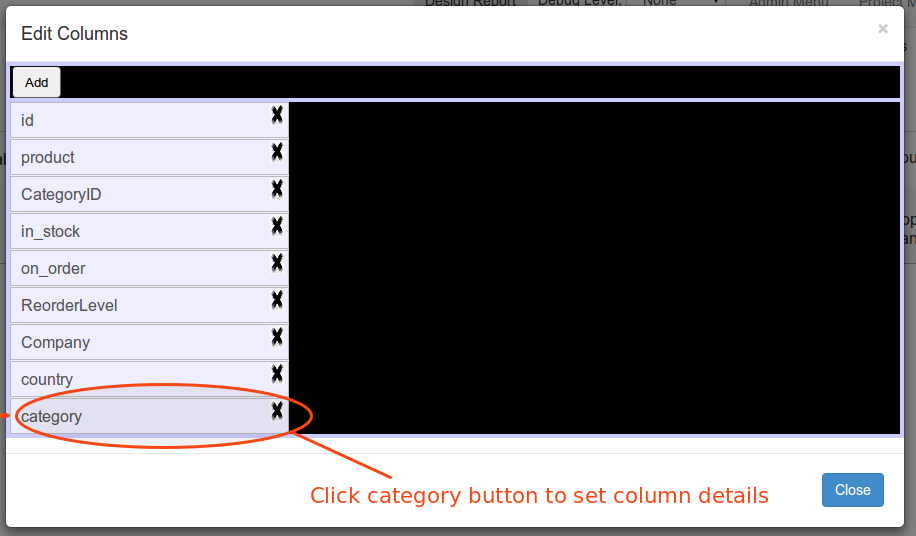
Now return to Run the report by pressing "Close". Now before we run our report we need to fix one thing. The category will display as a group header, but currently it will also display as a report column. So we need to hide the colmn from the report detail section. So press the "Columns button" as follows :-
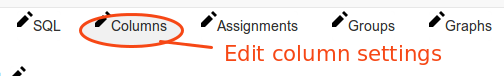
This show the column list. Select the category button:-
And set the Show or Hide property to "Hide".
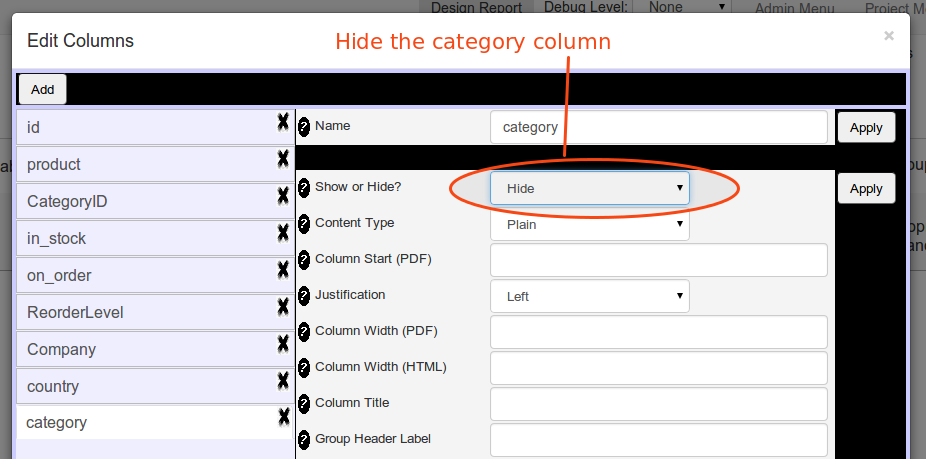
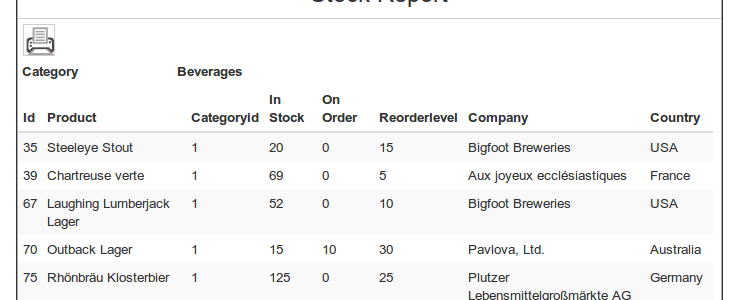
Press the Apply button and press Close. Now run the report. you should see the report output grouped by category. Notice that we also have some unnecessary columns id and category id. We can hide these in the same way.
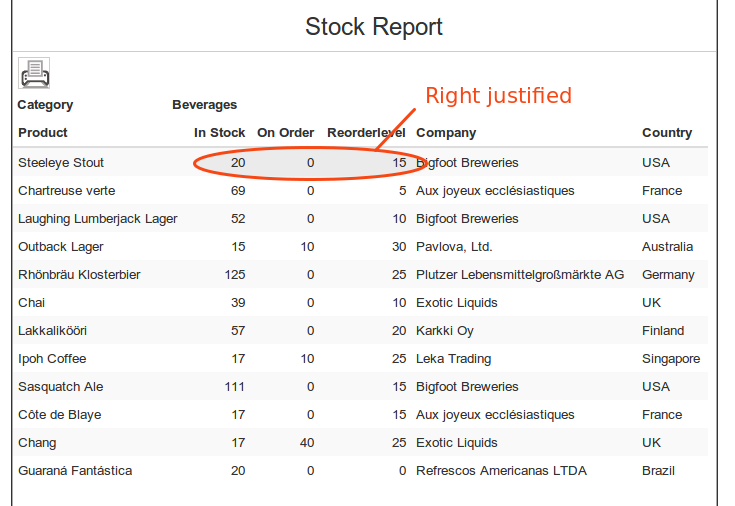
Also you can use the columns button to make the number values right justified so the report then looks as follows :-
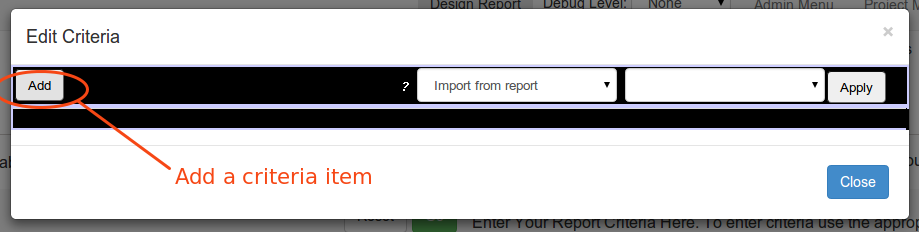
Press the Add button to add a new Criteria Item
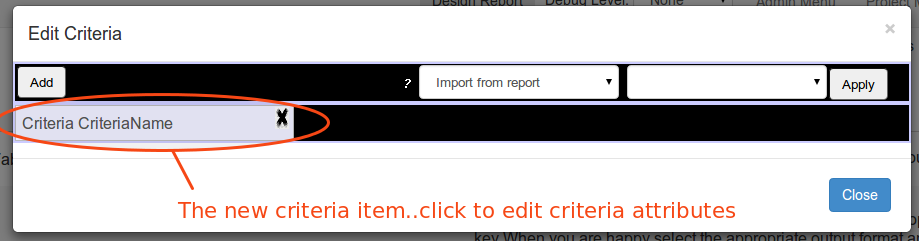
Press the CriteriaName button to reveal the criteria details pane:-
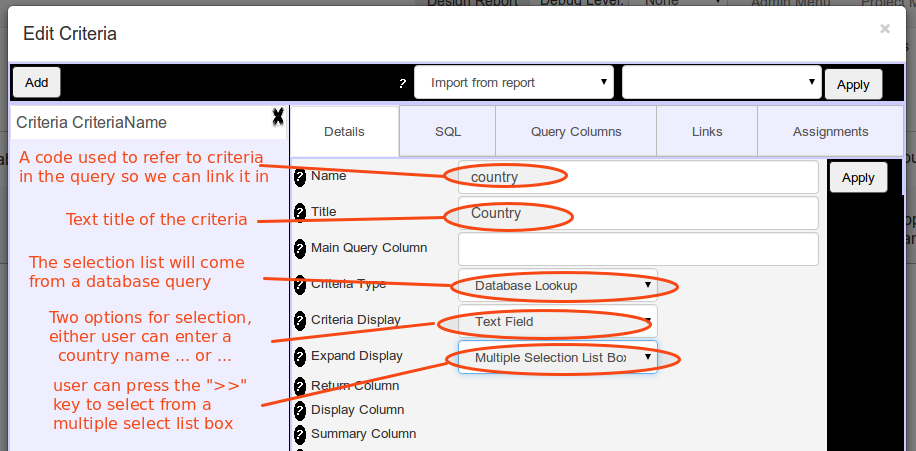
Set the fields as above and press Apply. Then press the SQL tab to enter the criteria query:-
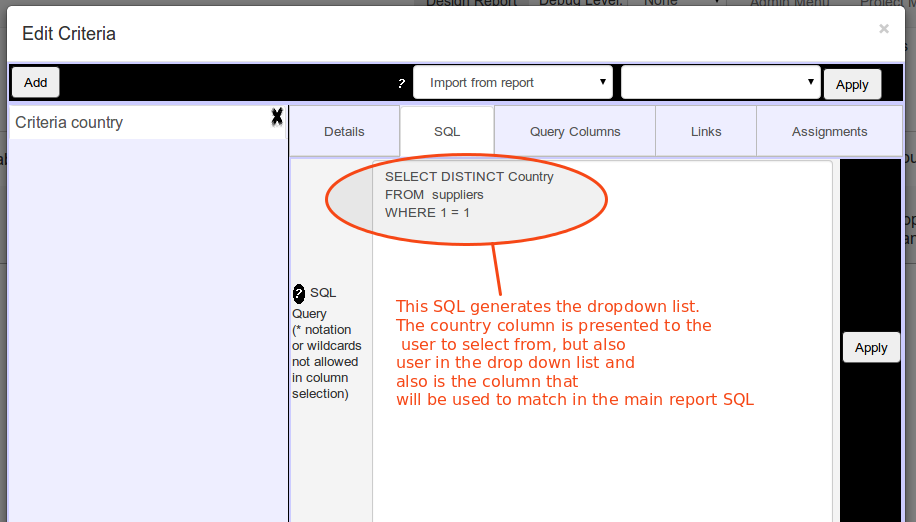
Enter the SQL as above, press Apply and then press the Details tab. Some new options appear:-
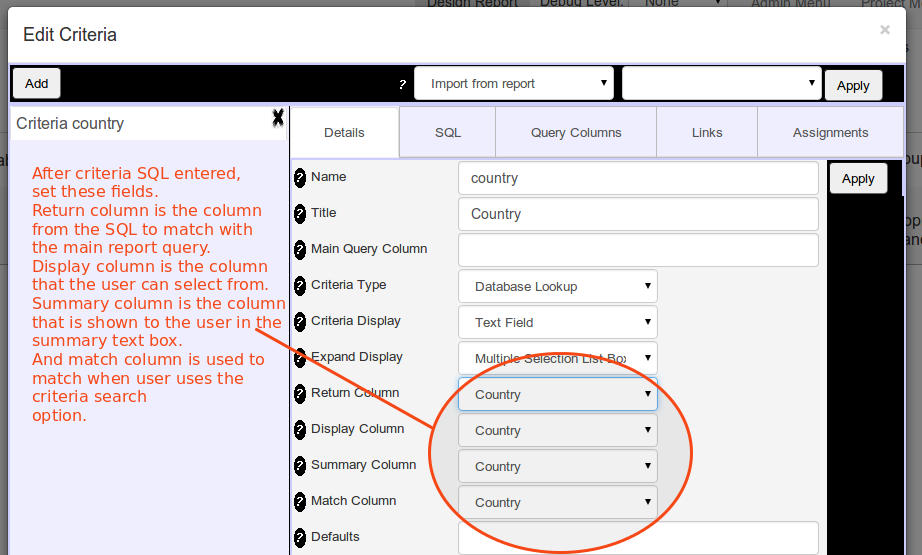
Set the Return Column, Expand Column, Return Column and Match Column as above and press Apply. Then close the criteria panel and enter the main report SQL by press the SQL pen button or pressing "Design Report" and navigating to the Query Details=>SQL tab:-
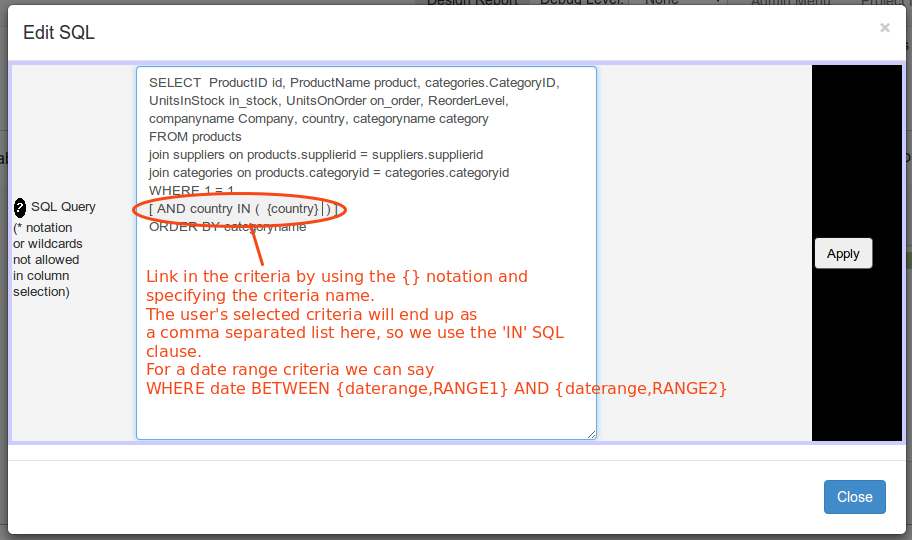
Link in the criteria as above, press Apply and return to the report execution screen.
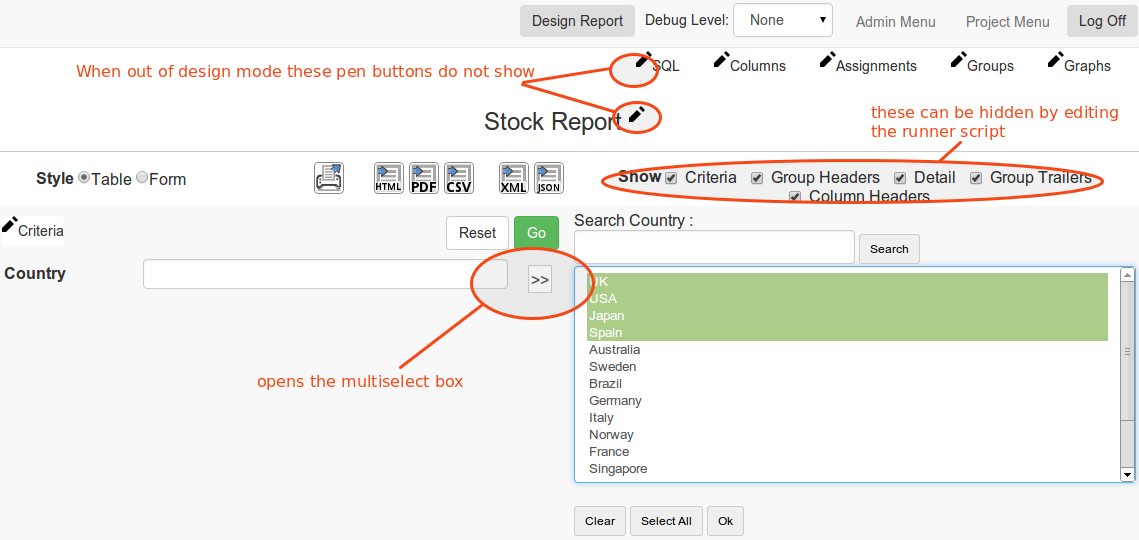
You can now run the report for specified countries. Either click on the ">>" to open the selection list or just enter some countries separated by "," in the text box.